IMO I think that the new 2014 F1 turbocharge engines will be using a radial turbo charger for these reasons.WhiteBlue wrote:I have not talked about the turbine pressure at all. So that is indeed not what I'm saying. Turbine and compressor pressures are dynamic values building continually up as the turbo spools up. There will be no interruption of the pressure build up when the MGU-H controller reaches the cross over point. The pressures will simply keep building up while generator load is build on the turbine.pgfpro wrote:So are you saying when the MGUH goes into generation mode and puts a load on the turbine there won't be an increase in turbine pressure???WhiteBlue wrote:I believe it will not work as shown in the diagram because the turbo has no waste gate. In fact it has a negative waste gate. It gets spooled up by battery power which you cannot show in a conventional turbo diagram. As rpm and mass flow builds the spool up power from the MGU is reduced to zero. Somewhere between 0-20 hp compressor power and 62 hp turbine power you cross that point. Then the MGU goes continuously into generation mode as turbine power keeps building up to the full 124 hp and compressor power keeps building up to 40hp. It is a continuous steady function of increasing the power of both units. The electricity generation has the function of the waste gate in a conventional turbo. It absorbs the excess power when the turbine has reached the cross over point.
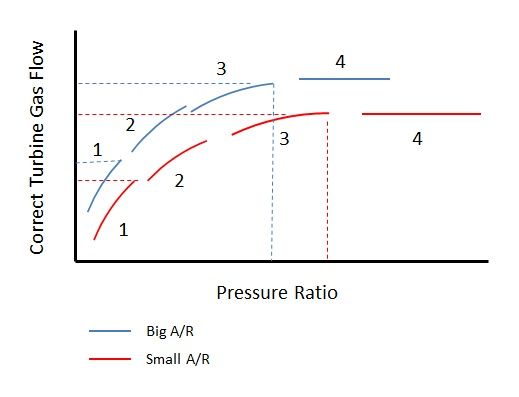
In my example the blue dot is after the full spool from the battery power. At this point you have almost reach max flow through the turbine. IMO you have to be at max turbine flow with a radial turbo before you can start adding a generator load to the turbine.
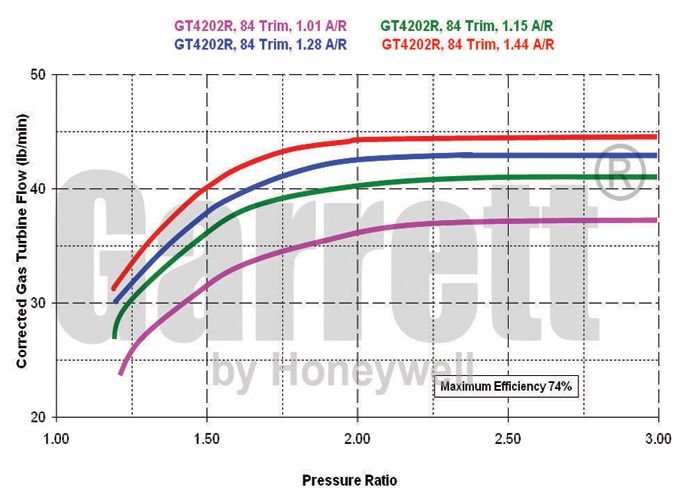
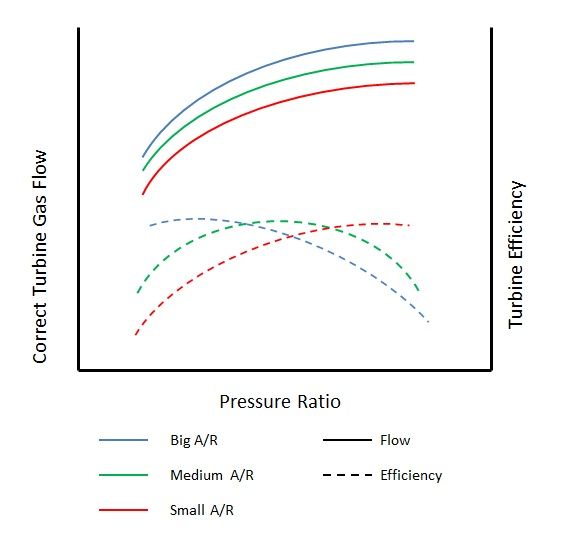
I don't know if your turbo diagram was made for an electric assist turbo charger. I suspect it is for an existing radial turbine. If I remember it correctly Ringo and I assumed in our input data a very high turbine efficiency as you see typically for an axial turbine. The idea was taken again from the Whright air craft turbo compounded engine which features three axial turbines for 18 pistons. In the F1 engine you will also have one turbine for six pistons. So the ratio is identical. We figured that an increase in manufacturing cost of an axial turbine compared to a radial would not stop the designers to use the most efficient design. The 2014 engine design will be totally focussed on milking the last available hp from those 27.8g of fuel flow that is allowed. Gaining a few points in turbine efficiency will be one path to achieving that.
As I have said before I'm not experienced in this field and I do not use such diagrams routinely. Perhaps it would help me if you explain how you got to the diagram and why it is applicable to the kind of design that F1 engine designers are likely to use in 2014. I could learn something useful that way.
1) The F1 drawings that we have seen so far look like a radial turbo.
2) Garrett Honeywell has had a radial turbocharger with an electric generator cartridge for a long time now. That helps spool and generates electric power.
3) Up to a wheel diameter of about 160 mm, today's radial-flow turbines are used. This corresponds to an engine power of approximately 1000 kW per turbocharger. From 300 mm onwards, only axial-flow turbines are used.
4) Turbine Wheel to turbine housing clearances are way more forgiving in a radial form and already proven in harsh road racing condition's WRC comes to mind.
5) F1 Technical Regulations mention of waste gate exit ( 5.3.8 )"Exhaust pipes beyond the turbine exit and beyond any waste gate exit".
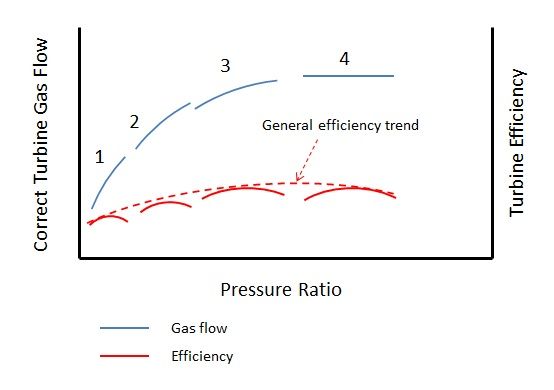
The example diagram is from Borg Warner's "Match Bot" turbo turbine selector. Its a over simplified turbine phi curve plot to show that a load from the MGUH would increase back pressure. I have several more turbine maps I will show later.
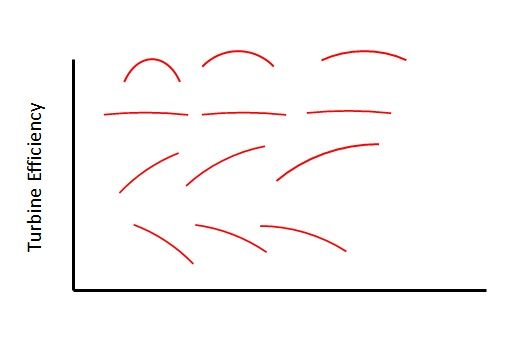
The vertical part of the curve is where turbine mass flow increases. It then reaches a point that you can see where it levels off and moves to the right of the map. Mass flow is vertical and turbine pressure is left to right. Mass flow levels off and turbine pressure increase. This is the point where the turbine becomes more efficient. Keep in mind that I used this turbine plot based on the size of the picture and for visualization. Radial turbine maps have several different curves. Some are more like a bell curve while other are vertical and some are almost flat.