Kozy wrote:
It doesn't need to be be amazingly accurate, I'm making free educational resource tools for hobbyists and enthusiasts so simplicity is key. If people want professional level accuracy, there are software programs with 5 figure price tags and a plethora of ultra confusing inputs that fill that market.
This is simply a step up from using Excel spreadsheets.

Nice work, but have you heard of GeoGebra?
http://en.wikipedia.org/wiki/GeoGebra It is a free geometry/algebra/spreadsheet program that I have used a few times in my course work, and I think it is awesome to do those interactive graphics. The spreadsheet part is not as good as Excel, but you can make it work. Also, it can be used in a browser at
http://web.geogebra.org/app/
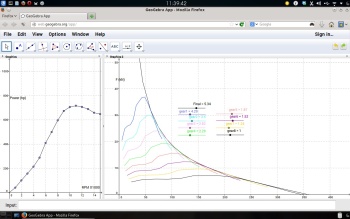
For example, I adapted something I did for school to get the tractive force graph with rscsr's drag assumptions and cosworth's engine power data, so one can edit the engine power curve and the gear ratios using sliders.
Here's the file (only 23kb):
https://www.dropbox.com/s/0miutijjhlcvc ... rtrain.ggb
Just open
http://web.geogebra.org/app/, and when it opens click file->open->open, and select the ggb file on the link above. The window should look like the screenshot below. If an algebra or spreadsheet frame window opens, you can just close them (or keep them open and look at the mess I made to make it work lol)

Edit: I forgot to write that the engine power curve is adjusted with the blue dots in the power curve. They move vertically, and the x coordinates are 1000rpm, 2000rpm, ... 15000rpm.


