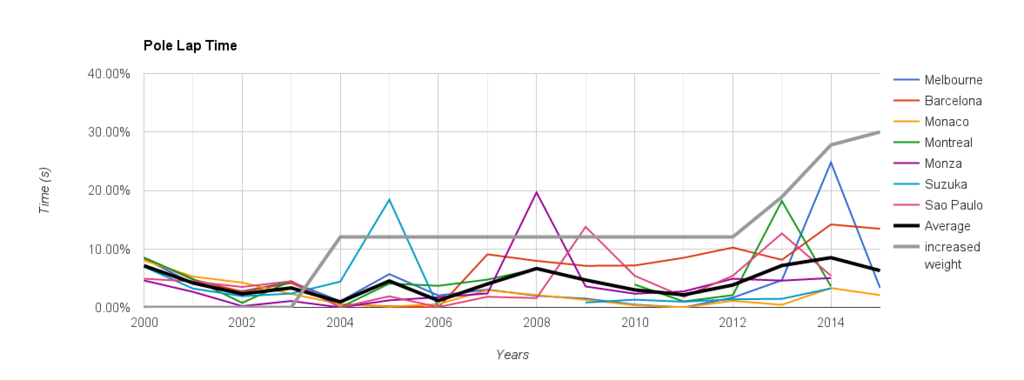
I have collated all of the pole lap times from 2000 to 2015 for all of the races on the 2015 calendar.
From this there are 7 races that are have been raced consistently on every calendar since 2000.
For each race I have converted each pole lap into a percentage against the best pole time at that track in the 15 year period. For example if the best pole was 100 seconds a pole of 110 seconds would rate as 10% slower on the below chart. I have not adjusted for weather or for track changes. The only adjustment is to 2008 and 2009 as Q3 had race fuel, in these years the best Q2 time has been taken.
Of these 7 races I have then taken an average for each year (thick black line) e.g. 2004 is on average within 1% of the best pole time achieved on each track in the period. The average series is distorted by Melbourne 2014 where due to rain the time was 25% slower than the best achieved.
Finally I have plotted the minimum car weights in grey (% increase over minimum in period). These were more difficult to find but I have taken the following:
2000-3 @ 540kg
2004-12 @ 605kg
2013 @ 642kg
2014 @ 690kg
2015 @ 702kg
This means that 2014 cars are 28% heavier than 2000-3 and 14% heavier than 2004-12 cars. Despite this they are only 5% slower over a lap than the best achieved in the period.
To be honest I had not appreciated just how much the weight has increased, graph below.

Im assuming there was a layout change to Barcelona in 2007 but I haven't looked into it.
Considering how little the lap times have increased for the increased weight I struggle to see how it can be possible that the cars have less power than before. If Melbourne and Barcelona were to be discounted then the cars would average about the same pace as 2012, but with an extra 85kg on board.
In general on the aero circuits the cars are slower but on the more power focused circuits the cars are setting very competitive times.
This years pole laps vs the best time in the last 15 years is as follows:
Melbourne 3.35%
Sepang 18.63%
Bahrain 3.03%
Shanghai 2.22%
Barcelona 13.44%
Monaco 2.10%
Ignoring a wet Sepang we are pretty close to 2004/2005 laptimes when the cars had 900-930bhp and weighed 605kg.
Thats a power to weight of 1490-1540 bhp/t
To match that with a 700kg car they would need to be making 1,043-1,078 bhp
So the question is, how many hundred bhp are you going to deduct to account for the slick tyres vs grooved?


