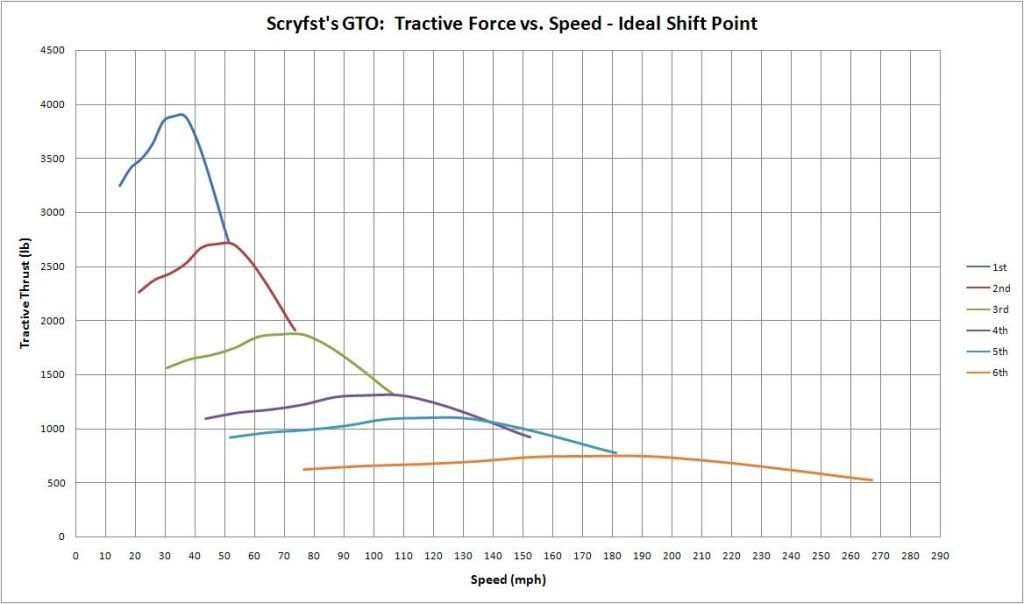
Machin's Performance prediction calculations

Post here all non technical related topics about Formula One. This includes race results, discussions, testing analysis etc. TV coverage and other personal questions should be in Off topic chat.
User avatar
mep
29
Joined: 11 Oct 2003, 15:48
Location: Germany

Re: Machin's Performance prediction calculations

Post

Which program are you using for it?

User avatar
machin
162
Joined: 25 Nov 2008, 14:45

Re: Machin's Performance prediction calculations

Post

I wrote it in Excel.... Its a 10MB file though... But there are sheets for doing loads of stuff like calculating resistive forces from coastdown testing
Data logging info, calculating engine power curves from acceleration runs etc...
COMPETITION CAR ENGINEERING -Home of VIRTUAL STOPWATCH

Jersey Tom
Jersey Tom
166
Joined: 29 May 2006, 20:49
Location: Huntersville, NC

Re: Machin's Performance prediction calculations

Post

Oh boy. Get yourself a copy of Matlab. Haha.
Grip is a four letter word. All opinions are my own and not those of current or previous employers.

autogyro
autogyro
53
Joined: 04 Oct 2009, 15:03

Re: Machin's Performance prediction calculations

Post

xpensive wrote:I doubt if the CVT has an efficiency as low as 88%, when considering the 800 Hp Williams Renault would have had a 70 kW loss, thats some 140 toasters.
It sure heats the drive belts up x.
CVTs only have a narrow range of ratios, they have to have extra gearing and a method of drive engagement from stationary.
They also use 'energy' on the control mechanisms.
The concept for high power use is self defeating.

User avatar
mep
29
Joined: 11 Oct 2003, 15:48
Location: Germany

Re: Machin's Performance prediction calculations

Post

machin wrote:I wrote it in Excel....
Now you are my friend 8)
I started to do something similar but stopped because of lack of time.
Maybe I can continue little bit during Christmas holidays.
Have you done it with pure excel tables or did you use some visual basic codes?
I am not very familiar with them, probably need to buy a book for learning it.

User avatar
machin
162
Joined: 25 Nov 2008, 14:45

Re: Machin's Performance prediction calculations

Post

I love excel! The program is basically pure excel... I've used visual basic just to import and save data automatically...

There's quite a bit of work in there... I've got calcs for cornering and braking too... Its accurate tyre data that takes its time to accumulate... Mine is 'reverse engineered' from data logger info from lots of vehicles and runs... Its generic, but good enough for my purposes...
COMPETITION CAR ENGINEERING -Home of VIRTUAL STOPWATCH

User avatar
ringo
230
Joined: 29 Mar 2009, 10:57

Re: Machin's Performance prediction calculations

Post

I have realized that constant power makes no sense throughout the rev range, the torque is too ridiculously high. Even with a measly 200hp engine.
It's like a shunt motor, in terms of the starting torque.
For Sure!!

User avatar
machin
162
Joined: 25 Nov 2008, 14:45

Re: Machin's Performance prediction calculations

Post

ringo wrote:With that constant power gear ratio
The gear ratio makes no difference as I've exlained before... I'm really disappointed in myself that I can't get you to understand that, I thought my description using power was pretty good..... But I want to give it one more go using Torque this time, because you seem to grasp that.

1, You do understand that if you know the power curve of an engine you can calculate the torque curve don't you? Power =Torque x Rotational Speed. Therefore if we have an engine that can make 600bhp from 0 to 12,000rpm the power and torque curves will look like this:-

Image


2, Lets take an example whereby the engine is mated to a 2:1 gear ratio and a 5:1 final drive, and the driven wheels are sized such that at 6000rpm in that gear the car is doing 100mph. (These are selected arbitrarily for illustration purposes only!)

3, The Torque at the engine at 6000rpm is 525lbft (from the graph -middle set of red arrows).

4, As you've said before (so I know you get this bit) the engine torque is multiplied by the gear ratio and the final drive, so the torque at the driven wheels is 5250lbft (525 x 2 x 5).

5, Now lets change the gear Ratio:- lets change it from 2:1 to 4:1. As we have doubled the gear ratio this halves the road speed, so we're now at 50mph, but we have 10500lbft (525 x 4 x 5). You rightly say that since the torque has increased the acceleration also increases!

6, But Wait, with our original gear ratio the constant power engine has more torque at lower engine speeds.... the equivalent engine rpm for 50mph and the gear ratio of 2:1 and final drive of 5:1 with the same sized wheels is 3000rpm (i.e. half the original engine speed we looked at since 50mph/100mph = 0.5).

7, If we now look back at the engine curves at 3000rpm how much torque does the engine produce? 1050lbft (see the left-most red arrow on the chart above). To get the torque at the wheels we need to multiply by the gear ratio and final drive again, so thats 1050 x 2 x 5 =10500lbft! EXACTLY THE SAME AS WE HAD IN STEP 5 WHEN WE DOUBLED THE GEAR RATIO!

And that's why a constant power engine doesn't benefit from multiple gear ratios.

Please let me know which step you lost track and I'll try and explain it again from there......
Last edited by machin on 21 Dec 2010, 10:19, edited 5 times in total.
COMPETITION CAR ENGINEERING -Home of VIRTUAL STOPWATCH

User avatar
machin
162
Joined: 25 Nov 2008, 14:45

Re: Machin's Performance prediction calculations

Post

ringo wrote:I have realized that constant power makes no sense throughout the rev range, the torque is too ridiculously high. Even with a measly 200hp engine.
It's like a shunt motor, in terms of the starting torque.

That's right, its pointless at very low speeds because no car has the grip to use all that torque. But that doesn't mean a constant power engine can't work in a vehicle, and it would add performance if the constant power rpm range is wide enough. As I said before: the torque and power curves represent the power output at full throttle with the correct amount of fueling. If you reduce the throttle opening and the fuel you'll also reduce the power and torque output of the engine, and therefore the car won't spin its wheels at low speeds.

Even my own track car with 140bhp will spin its wheels all day if I use full throttle in 1st gear from a standing start (it is very light), but I can assure you that I can get the car moving in 1st gear without spinning its wheels -I simply use less throttle.

For the calculation purposes the acceleration is calculated from the lower value of either: The forces produced by the engine at the driven wheels or the maximum allowable by the level of grip at the driven wheels. If the force is limited by the grip levels then in reality, to achieve the level of acceleration calculated by my program, the driver will have to use part-throttle until he reaches a speed where there is enough grip to use full throttle.

Take for example driving on ice; pretty much all cars have more than enough power/torque to spin they're wheels... but you can move the car forward by using a very small throttle application....
Last edited by machin on 21 Dec 2010, 12:54, edited 3 times in total.
COMPETITION CAR ENGINEERING -Home of VIRTUAL STOPWATCH

User avatar
747heavy
24
Joined: 06 Jul 2010, 21:45

Re: Machin's Performance prediction calculations

Post

other place same debate:

http://twoguysrally.com/2008/04/08/engi ... orsepower/

Image
Image
Image

and here Ford´s claim for their new 3.5 ltr Eco boost engine
(sure there is a PR-factor/photoshop element to the data)

Image
"Make the suspension adjustable and they will adjust it wrong ......
look what they can do to a carburetor in just a few moments of stupidity with a screwdriver."
- Colin Chapman

“Simplicity is the ultimate sophistication.” - Leonardo da Vinci

User avatar
747heavy
24
Joined: 06 Jul 2010, 21:45

Re: Machin's Performance prediction calculations

Post

some similar discussions, about the advantages of CVT, coming closer to the constant power line and optimum shift points/gears/engine mapping

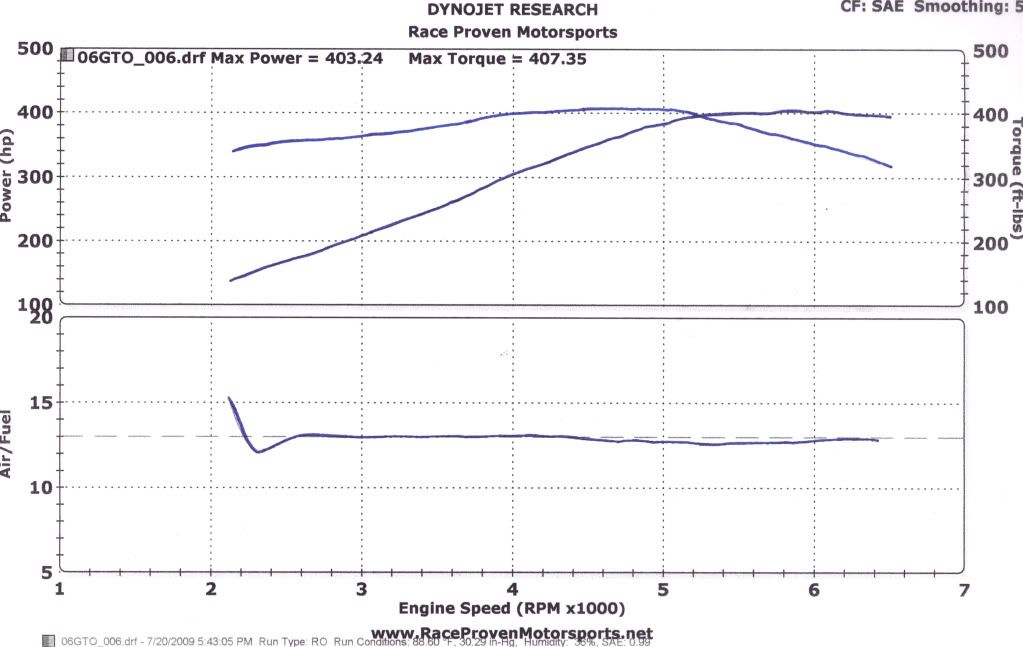
note, that this engine has CONSTANT POWER from ~5200 - 6200 rpm, this characteristic I would expect to see with the 2013 F1 engines, probably over a even larger rpm range.

http://www.ls1gto.com/forums/showthread.php?t=334833

Image
Image
"Make the suspension adjustable and they will adjust it wrong ......
look what they can do to a carburetor in just a few moments of stupidity with a screwdriver."
- Colin Chapman

“Simplicity is the ultimate sophistication.” - Leonardo da Vinci

User avatar
mep
29
Joined: 11 Oct 2003, 15:48
Location: Germany

Re: Machin's Performance prediction calculations

Post

Why you talk so much about CVT?
You can do your excel graphs also with a regular gearbox.
Have I missed something here, could be because I had just the time to quickly fly over it.

User avatar
machin
162
Joined: 25 Nov 2008, 14:45

Re: Machin's Performance prediction calculations

Post

@ MEP: Yeah, the first force graph (and the acceleration graph) on page 1 are for a conventional, 7 speed gearbox.

We're just discussing the merits of the "ideal" (Constant power engine with one gear), vs a peaky engine with lots of gears, vs a peaky engine with a CVT.....
COMPETITION CAR ENGINEERING -Home of VIRTUAL STOPWATCH

User avatar
747heavy
24
Joined: 06 Jul 2010, 21:45

Re: Machin's Performance prediction calculations

Post

mep wrote:Why you talk so much about CVT?
You can do your excel graphs also with a regular gearbox.
Have I missed something here, could be because I had just the time to quickly fly over it.
yes, it´s not a problem to calculate the graph.
But you would like to follow the ideal constant power line as close as you can, for
max acceleration.
To do this, depending of your engine power curve, you may need as many gears as you can get.
This is where CVT comes in.

Let´s take Machins example: he uses a constant torque engine and a 7 speed gearbox.
His engine/gearbox combination (fat dark green line), touches the constant/max power line (magenta) 7 times, and only at this point, his engine produces max. power. The area (red lines)in between the green and the magenta line is the time when the engine does not operate at max power. To fill out this area (with this engine) you would need more gears, as more as better. This is where CVT for this engine would be a advantage.

But because a real world engine is not max. torque through it´s rpm range, there are other options/possible combination to try to come as close as often to the constant/max power line (magenta) as possible. This is where the last graphic in my last graph comes in.
This engine has ~1000rpm where it produces close too max. power, this means for this 1000rpm it will follow the magenta line perfectly.

Image

Make sense?
Merry Christmas mep
Last edited by 747heavy on 21 Dec 2010, 14:24, edited 2 times in total.
"Make the suspension adjustable and they will adjust it wrong ......
look what they can do to a carburetor in just a few moments of stupidity with a screwdriver."
- Colin Chapman

“Simplicity is the ultimate sophistication.” - Leonardo da Vinci

User avatar
machin
162
Joined: 25 Nov 2008, 14:45

Re: Machin's Performance prediction calculations

Post

747heavy wrote: Transmission type Efficiency
Manual 97%
CVT toroidal 93%
One advantage in the CVT's favour is the fact that the engine can be operated at one speed which means it can be optimised for that speed. The chart below is from an engine we are using at work, showing how its efficiency decreases as we drop down the rev range (this is for a twin turbo-charged, direct injection V engine). So we may loose efficiency in the CVT gearbox, but we gain some (possibly all!) back by operating the engine at one speed..... We also gain performance because we don't need to waste time changing gear....

Image
COMPETITION CAR ENGINEERING -Home of VIRTUAL STOPWATCH