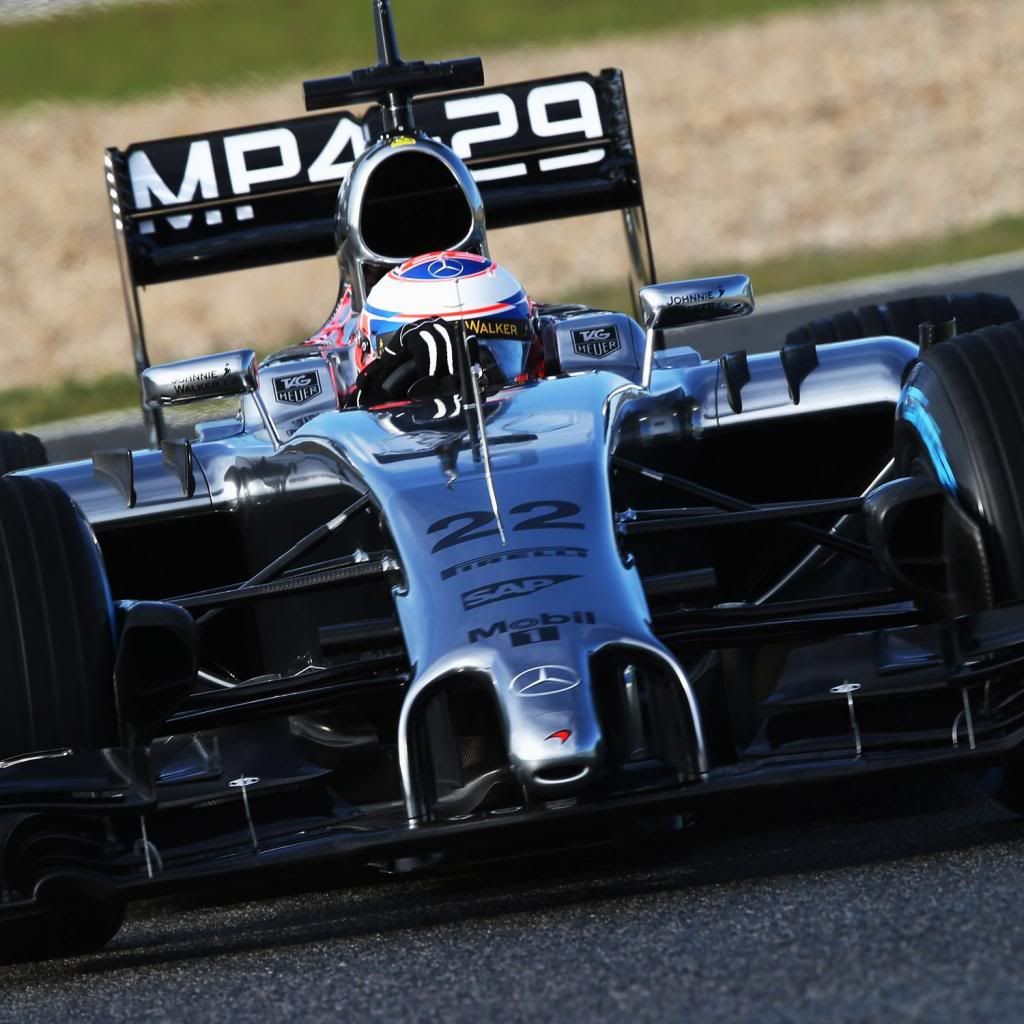
For this image I took a rough trace of the McLaren and overlaid it on the Ferrari and Red Bull. You can clearly see how the tea tray doesn't line up, showing the differences in angles, but you can get a rough comparison.


No, they're from the same image. However looking at the rear wheel tracing it aligns perfectly with the rear wheel of the Red Bull (which was how I originally scaled those two, switching to the front wheel when doing all the others). The tracing on the front wheel of the McLaren was also a little poor, being slightly squashed.feynman wrote:Are those tracings with the scaling corrected?

From another forum:mx_tifosi wrote:Of course, but if someone has already done the numbers it would be great if they could share it with us, no?

that's indeed the general trend, but this year both Ferrari and Redbull did a large number of laps during the first week of testing already.richard_leeds wrote: Having said that, the first week of testing is often a low mileage affair as the teams tinker with a broad range of different parts & settings.
actually, the best would be somebody plots the lap times for all long runs, incl. Shumu, Rubens, etc. This would give a better idea how fast the lap times fall, because the longer the run the larger the RMS will beraymondu999 wrote:Make of it what you will, but I calculated the standard deviation of Alonso's first long run, and Vettel's first long run from Jerez. This should give a good idea of consistency, and how the long runs are holding up with the tyre wear I guess. But then again normal distribution and standard distribution works in either way, so not entirely sure how that would skew things. FWIW, for Alonso's long run, the standard dev I got was 0.823, and Vettel's was 0.933, to 3dp, obviously.