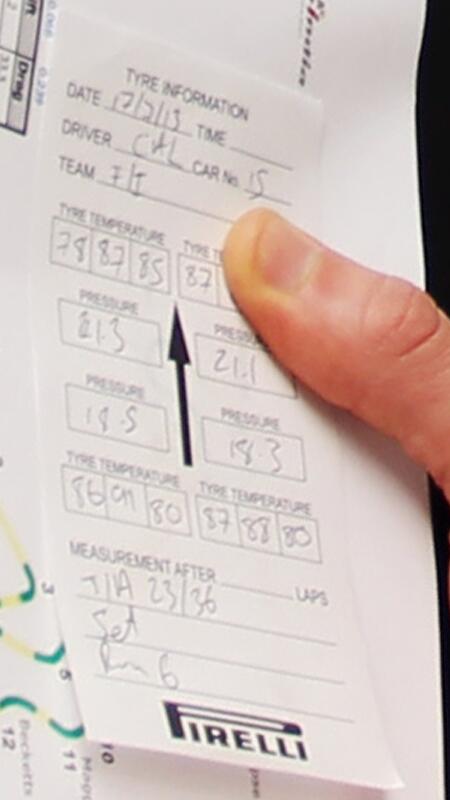
Magnified Image credit: Mario @Techf1iles
Original photo is provided by the team official image stream, which I find fist here.


You were right, I guess it's close to deadlines and RB had to choose or pretend to choose. What if RB hires Raikkonen, will they replace Vergne with DaCosta? Or maybe ditch both?turbof1 wrote:Ricciardo will also test for Red Bull:
http://www.autosport.com/news/report.php/id/108807
Off topic, but this also implies Vergne is out of the running for next year's Red Bull seat.
The image tells us two things for sure: pressures are up, while the operating temperatures are down.Blanchimont wrote:Yeah, i noticed that, too.
But what exactly does the table tell us? Is it about sector times (S1, S2 and S3 in the first row) for different vehicle configurations? A car weight of 27.6 would make no sense, for example.


stefan_ wrote:Well yes, being on the other side of the continent I am behind you.
I'll get further on that in the "who will replace webber" topic.iotar__ wrote:You were right, I guess it's close to deadlines and RB had to choose or pretend to choose. What if RB hires Raikkonen, will they replace Vergne with DaCosta? Or maybe ditch both?turbof1 wrote:Ricciardo will also test for Red Bull:
http://www.autosport.com/news/report.php/id/108807
Off topic, but this also implies Vergne is out of the running for next year's Red Bull seat.
Young drivers test, another formula 1 success story: Prost, Paffett and Rigon running aero test. I want speed shoot-outs for a seat goddammit.