FWIW

http://www.ral.ucar.edu/hurricanes/real ... /wp182014/
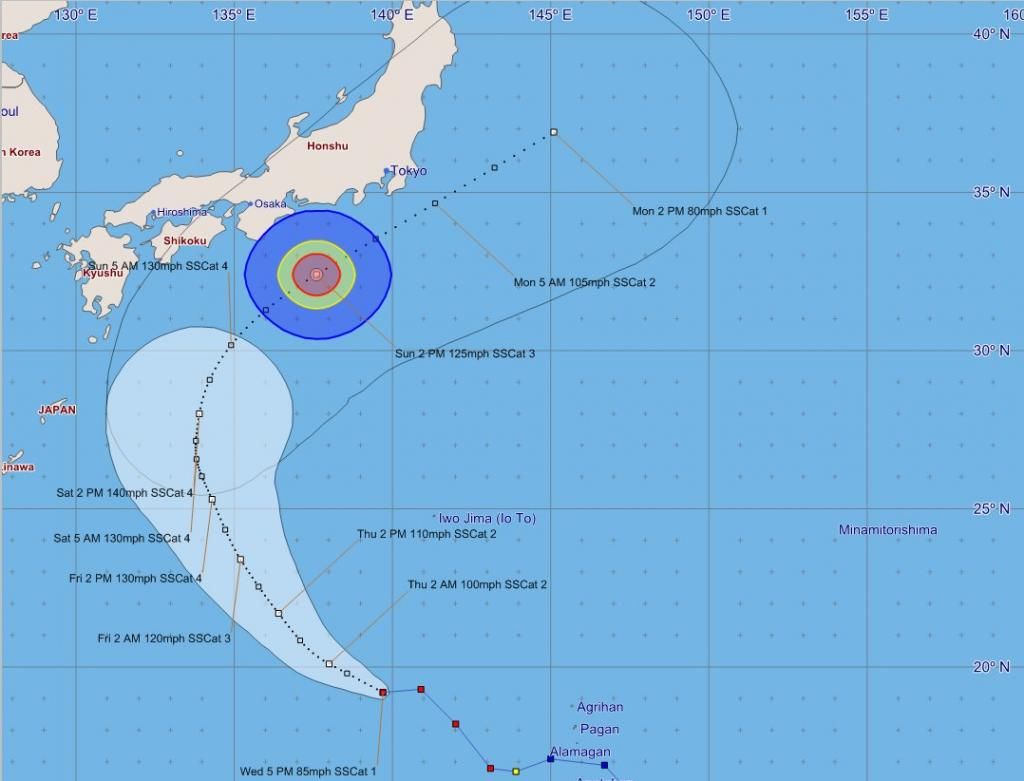
Here is the latest forecast track. (Note time is NOT local) it is US EDT. Sun 2 PM US EDT is Mon 3 AM local. I wanted to show the closest approach to Suzuka in the image, not the location of the storm at race time (especially given potential track/speed errors).

Couple things to keep in mind. The large cone is based on forecast error data and basically shows where the center could track. Keep in mind the center could still end up outside the cone. Even if it is on the edge of the cone the storm is not a point so its effects would extend well outside the cone. The wind radii (blue is 34 kt, yellow is 50 kt, and red is 64 kt) are broken into quadrants and delineate the maximum possible distance from the center a certain wind speed may be experienced within that quadrant. It is quite possible to not experience 34 kt or even 25 kt within the 34 kt wind radii.
Also a strong tropical system often causes a ring of hot/dry weather outside the storm itself. Air being exhausted by the storm will sink around the storm's perimeter causing warming and drying. The current forecast track/strength could very well cause this at Suzuka (tho timing for the race itself is in question).


