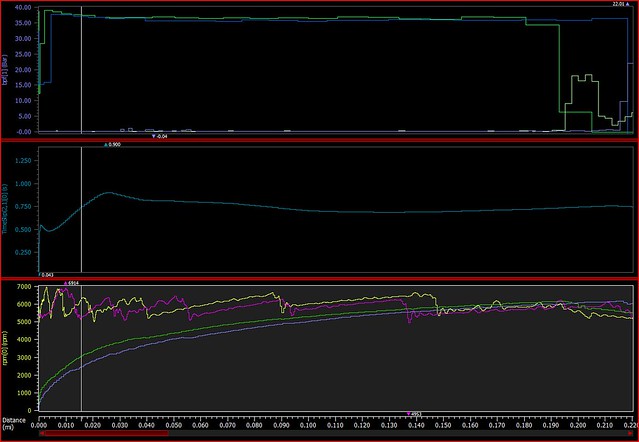
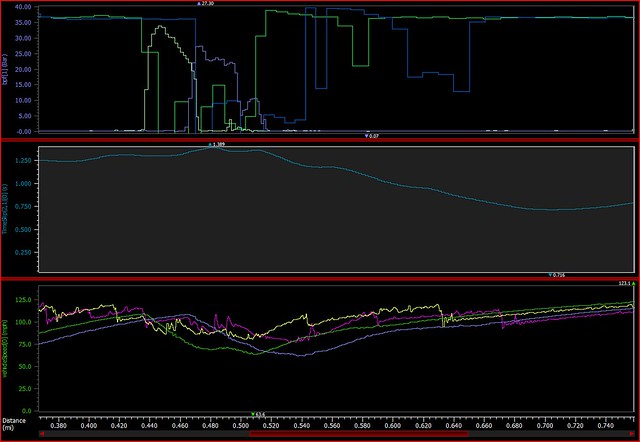
At the start/finish line Andy is travelling at 108mph vs Andrew’s 103.3mph. This adventage shows itself in Andy taking 0.25 seconds by Folly where Andrew appears to have matched the speed and continues to go faster. Andrew initially gains by holding onto the gears longer and his line is clearly better up Avon Rise as he continues to accelerate quicker. Andrew reaches 139.8mph before swapping throttle for brake, whilst Andy makes just 137.5mph 0.65 seconds later.
Both drivers brake in two parts; before and after Avon Rise. Andrew takes a longer and harder stab before the rise, whilst Andy takes a similar length but harder stab after the rise. Andy drops from 112.6mph to 68.3mph, whilst Andrew drops from 99.4mph to 67.8mph over the same period. By this time, Andrew is 0.394 behind, compared to 0.188 before he braked. Apex speeds are practically identical, but Andrew holds third gear, whilst Andy holds fourth. This results in a slower throttle pickup for Andrew, but the wheel torque will effectively be the same. Andrew is flat out by the time he selects fourth on the exit of Quarry.
Andrew is 1mph slower on the exit of Quarry, but is again caught up at the end of the straight by revving to 6500rpm instead of Andy’s 6000rpm. Andrew brakes for The Esses 1.2 seconds before Andy, braking for longer but not as hard. Andy approached in sixth, whilst Andrew arrived in fourth gear; fifth is probably right. Andrew dropped one gear, whilst Andy dropped two. Both drivers stabbed the throttle between apexes and Andrew’s longer stab gained 0.01 seconds.
On the exit, a spike in the RPM trace and a big dip in the steering angle coinciding with throttle application for Andrew shows power-on oversteer, whereas Andy’s earlier application of throttle is not affected due to the higher gear selected. The oversteer moment cost 0.15 seconds, which was almost 0.4 seconds by the time the corner was completed. Both drivers took a big lift into Old Paddock. Andrew took two up-shifts in quick succession, whilst Andy short-shifted into fifth. Both approaches were remarkably similar with exit speeds almost identical.
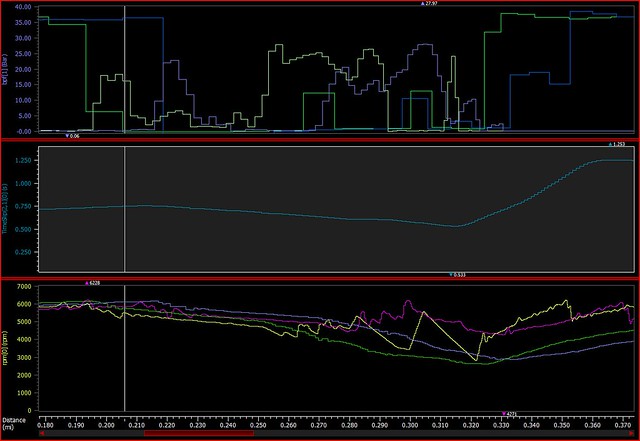
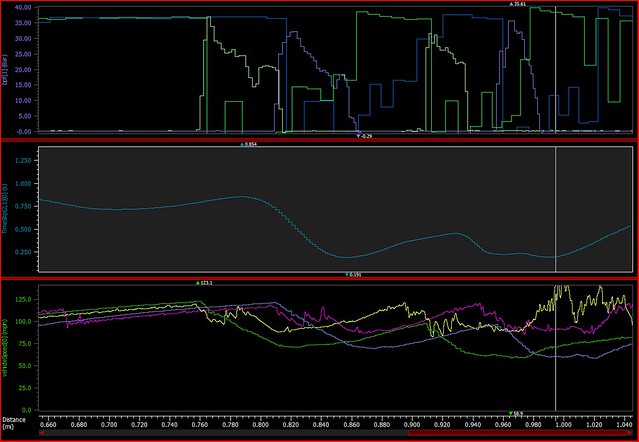
Onto the second graph, Andrew was off the throttle into Hammerdown. Whilst this looks strange and like he might have been following another car, it’s not too surprising as Tower is a particularly daunting corner. The time slip went from 1.679 to 2.293 seconds from when Andrew lifted off the throttle to when Andy did and this extended to 2.664 seconds by the apex as Andrew didn’t need to brake so hard
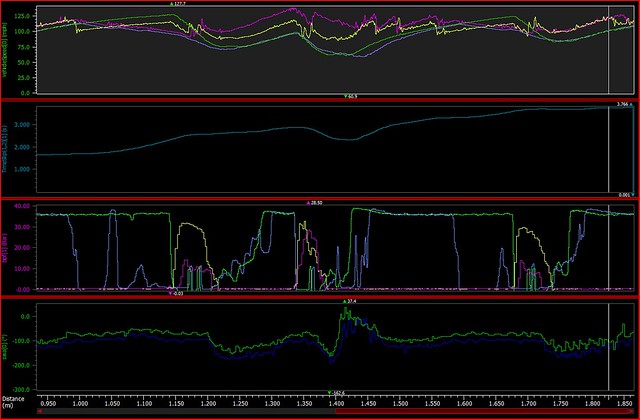
Again, Andrew was in a lower gear (3rd vs 4th) and this resulted in throttle modulation through Tower with corresponding wavering of the steering wheel. Andy arrived at Bobbies 1.7mph quicker as a result. Whilst both drivers lifted off at the same point for Bobbies, Andrew braked later, gaining half a second from turn-in to the second apex. At this point, Andy was at full throttle in third gear, whilst Andrew had both feet off the pedals in second and the first application of throttle shows a rise in RPM and opposite lock application. As the throttle is applied, the RPM trace wavers, showing the rear wheels are spinning. Both drivers upshift at the same point; Andrew into third and Andy into fourth.
Westway marks what would be the finish of the Dick Mayo Sprint on Saturday and the timeslip is 3 seconds. This continues to climb all the way to Camp as a result of the differing exit speeds from Bobbies. Again, Andrew is early off the throttle before Camp, losing 0.25 seconds in the process. Andy is first on the brakes with twice the pedal effort and both arrive at the apex in fourth gear. Andrew’s apex speed is higher, but exit speeds were almost identical Andrew passed the finish line quicker thanks to holding onto the gears longer.
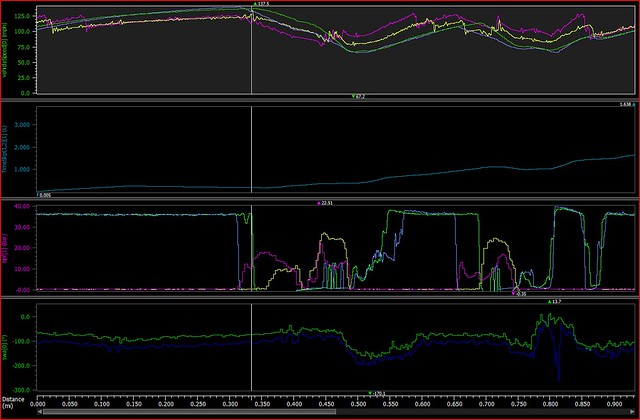
The longitudinal G trace doesn’t go much beyond 1.2G under braking for either driver, which considering the lateral G hits a solid 1.8G, suggests that either the car is not strong on the brakes or the drivers both need to press the brakes harder. If it’s the car, then the camber or brake balance could be the cause. The only suggestion of a partial lock-up is the front-left over Avon Rise on these laps, but other laps show that the front tyres are under-rotating at various corners, despite no greater retardation. The image shows front left with front right wheel speeds, brake pedal pressure with throttle and longitudinal G. On this basis, it seems that the car is the limiting factor, either through too much static camber or a forwards brake bias.

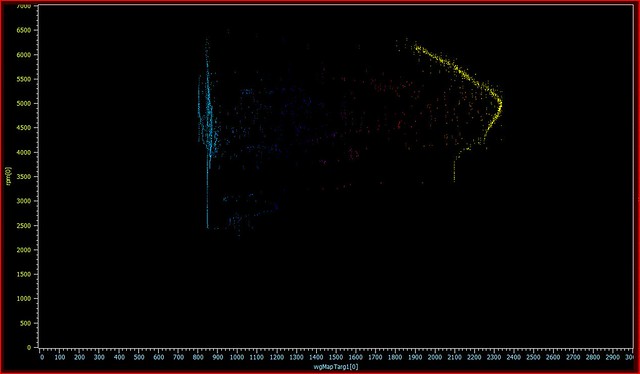
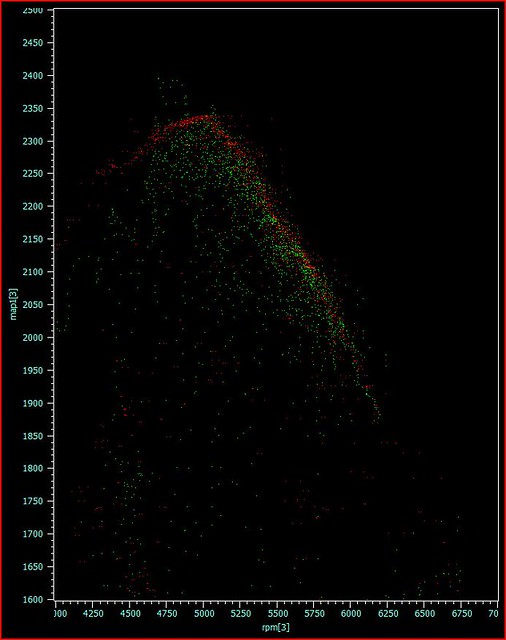
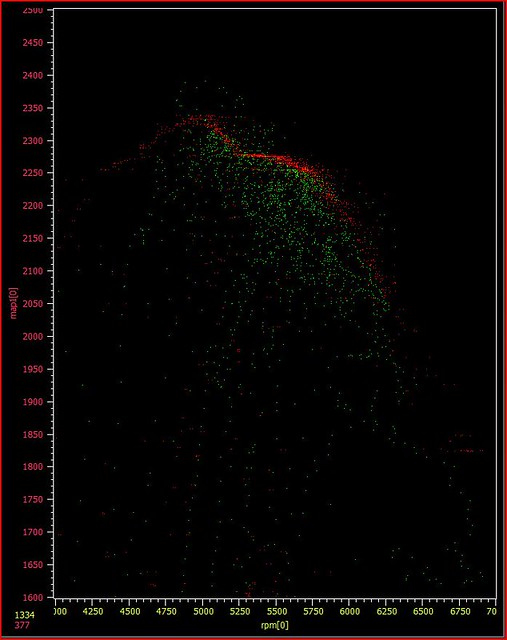
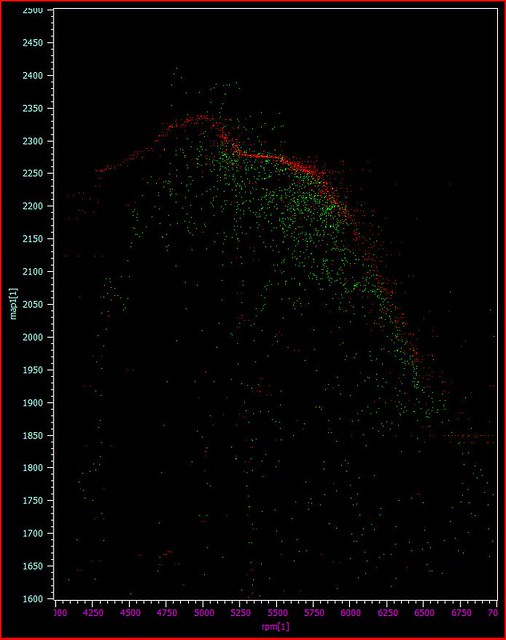
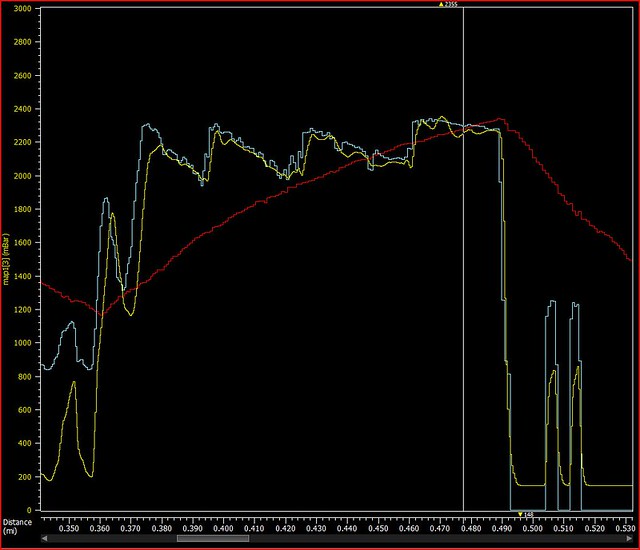
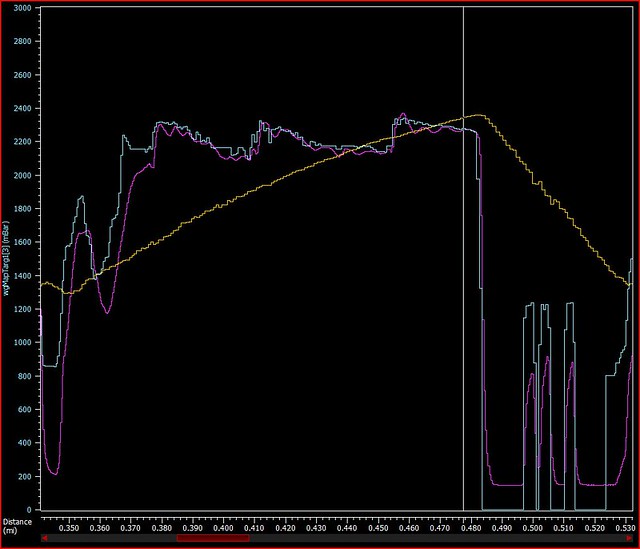
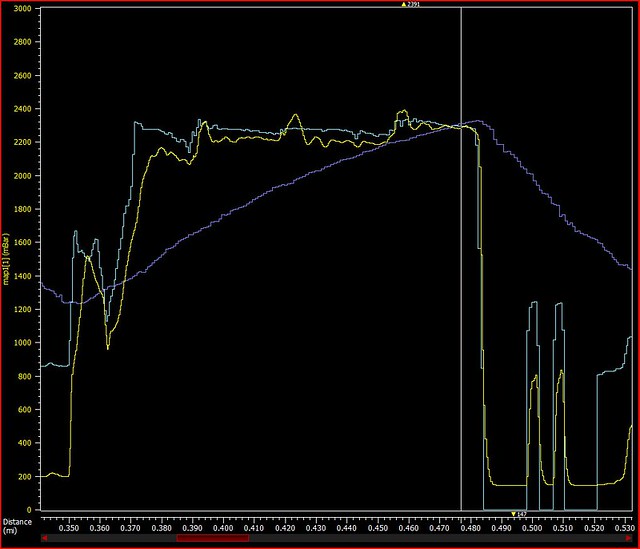
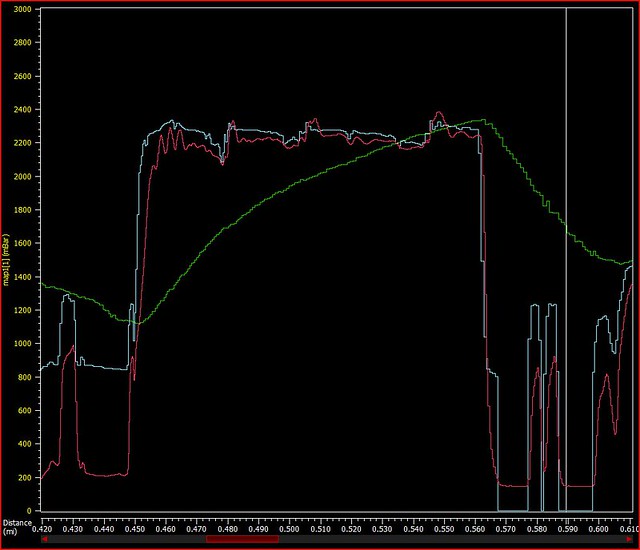
Looking at other parts of the car, the charge intake temperature doesn’t exceed 53 degrees and the boost pressure peaks at 2.4bar absolute. Injector time peaks at 77.86%, which suggests that 25% more fuel could be injected. Keeping the lambda target the same, this means there’s a fair bit more power to come. Lambda target is 0.88-0.96, so a little rich and headroom still. More boost required? The boost target drops from ~2.3bar at 5000rpm to ~1.9bar at 6000rpm.
