F1 2016 vs 2017: mathematical/statistical comparison

Post here all non technical related topics about Formula One. This includes race results, discussions, testing analysis etc. TV coverage and other personal questions should be in Off topic chat.
User avatar
whatthefat
0
Joined: 13 Sep 2014, 01:02

Re: F1 2016 vs 2017: mathematical/statistical comparison

Post

Okay, I've just finished my full analysis of the testing data, which I've posted here: https://f1metrics.wordpress.com/2017/03 ... -analysis/

Happily, I was able to get my hands on some 2010 testing data, which I'd be glad to share (just email me from the info on the blog's about page if you're interested).

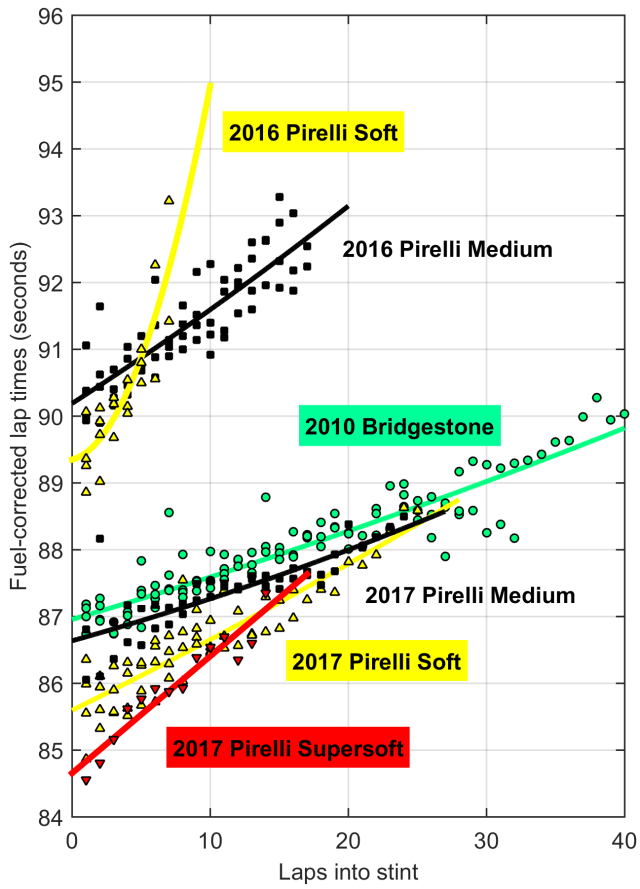
Here is a probably my favorite part of the analysis: a graph showing relative tyre performance in 2010 vs. 2016 vs. 2017.

Image

ripper
ripper
39
Joined: 26 Aug 2015, 22:19

Re: F1 2016 vs 2017: mathematical/statistical comparison

Post

Thanks a lot! Reading it now!

User avatar
Phil
66
Joined: 25 Sep 2012, 16:22

Re: F1 2016 vs 2017: mathematical/statistical comparison

Post

Wow, what an impressive article whatthefat. Just wow. Anyone here should go read it. Very impressive stuff.
Not for nothing, Rosberg's Championship is the only thing that lends credibility to Hamilton's recent success. Otherwise, he'd just be the guy who's had the best car. — bhall II
#Team44 supporter

ferkan
ferkan
31
Joined: 06 Apr 2015, 20:50

Re: F1 2016 vs 2017: mathematical/statistical comparison

Post

Hey whatthefat! Fantastic work, much better then any big name site did, incredible!

That Merc 7 lap stint is incredible, but I remember there was similar one from Vettel as well. I'll find it, think it was from 1st or 3rd day. He started with 1:21.1 on mediums and went for 10 more laps or so.

Here it is :

https://www.autosport.com/live/commenta ... st-day-one

From 12:42 he does 1:21.1, follows with 1:21.4 and then continues for 6 more laps 21s within few tenths.

He didnt pit that time until the end of session if I remember correctly.

User avatar
Nuvolari
3
Joined: 07 Apr 2016, 14:10

Re: F1 2016 vs 2017: mathematical/statistical comparison

Post

whatthefat wrote:Okay, I've just finished my full analysis of the testing data, which I've posted here: https://f1metrics.wordpress.com/2017/03 ... -analysis/

Happily, I was able to get my hands on some 2010 testing data, which I'd be glad to share (just email me from the info on the blog's about page if you're interested).

Here is a probably my favorite part of the analysis: a graph showing relative tyre performance in 2010 vs. 2016 vs. 2017.

https://f1metrics.files.wordpress.com/2 ... .png?w=640
Thanks for the effort! About that fast stint from Mercedes that put a bit of block on things...I seem to remember a similar stint in 2016 preseason by Rosberg? And it was not representative of the Mercedes race pace come Spanish GP, IIRC (simply looking the long runs in free practice). Also, probably best not compare a 'standalone' Mercedes stint to a race sim Ferrari stint...Anyhow, looks like Melbourne will probably give us a real glimpse of the year. Exciting times. Here's to some competition at the front.

User avatar
whatthefat
0
Joined: 13 Sep 2014, 01:02

Re: F1 2016 vs 2017: mathematical/statistical comparison

Post

ferkan wrote:Hey whatthefat! Fantastic work, much better then any big name site did, incredible!

That Merc 7 lap stint is incredible, but I remember there was similar one from Vettel as well. I'll find it, think it was from 1st or 3rd day. He started with 1:21.1 on mediums and went for 10 more laps or so.

Here it is :

https://www.autosport.com/live/commenta ... st-day-one

From 12:42 he does 1:21.1, follows with 1:21.4 and then continues for 6 more laps 21s within few tenths.

He didnt pit that time until the end of session if I remember correctly.

Thank you! So I checked this one out and it wasn't in the f1debrief stints published, so not in my dataset, but it may indeed be comparable to the Mercedes soft stint. Unfortunately, it isn't 100% clear to me how to interpret that autosport commentary. It could be that he started with a couple of quick laps then settled into a consistent but slower pace for 6+ laps. How I wish we had all the data!

kooleracer
kooleracer
24
Joined: 05 Jan 2012, 16:07

Re: F1 2016 vs 2017: mathematical/statistical comparison

Post

@Whatthefat thank you for your analysis. It shows why teams always say they focus on themselves during testing and do not pay attention to the opposition. Because the amount of variables makes any useful analysis incredibly hard. Like you said Melbourne will give us a better view of the level of performance between the team. I think that we have to wait for China and Bahrain for a definitive answer about the pecking order. Having said that, I still enjoyed the analysis especially the part that shows the flaws of analysis from major F1 websites.
Irvine:"If you don't have a good car you can't win it, unless you are Michael or Senna. Lots of guys won in Adrian Newey's cars, big deal. Adrian is the real genius out there, there is Senna, there is Michael and there is Newey.They were the three great talents."

User avatar
whatthefat
0
Joined: 13 Sep 2014, 01:02

Re: F1 2016 vs 2017: mathematical/statistical comparison

Post

Pierce89 wrote:Which 2010 compound is the one thats very close to the 2017 medium?
I think it's the soft compound, based on some inference of what people reported that day, but it wasn't actually recorded in the dataset or anywhere in articles I could find.

User avatar
Pierce89
60
Joined: 21 Oct 2009, 18:38

Re: F1 2016 vs 2017: mathematical/statistical comparison

Post

whatthefat wrote:
Pierce89 wrote:Which 2010 compound is the one thats very close to the 2017 medium?
I think it's the soft compound, based on some inference of what people reported that day, but it wasn't actually recorded in the dataset or anywhere in articles I could find.
Cool. Good work.
“To be able to actually make something is awfully nice”
Bruce McLaren on building his first McLaren racecars, 1970

“I've got to be careful what I say, but possibly to probably Juan would have had a bigger go”
Sir Frank Williams after the 2003 Canadian GP, where Ralf hesitated to pass brother M. Schumacher

User avatar
Mr.G
34
Joined: 10 Feb 2010, 22:52
Location: Slovakia

Re: F1 2016 vs 2017: mathematical/statistical comparison

Post

whatthefat wrote:
ferkan wrote:Hey whatthefat! Fantastic work, much better then ...
Thank you! So I checked this one out and it wasn't in the f1debrief stints published, so not in my dataset, but it may indeed be comparable to the Mercedes soft stint. Unfortunately, it isn't 100% clear to me how to interpret that autosport commentary. It could be that he started with a couple of quick laps then settled into a consistent but slower pace for 6+ laps. How I wish we had all the data!
Hi whatthefat, I've scrutinized the internet, did some magic and found a few more info about the Vettel's stint. I know it's not much but could you plase do youre magic and try to compare this to the Hamiltons stint?

From here - link
12:42 - The Ferrari driver has clocked a 1m21.127s
12:43 - Vettel follows up his 1m21.1s with a 1m21.4s. Good start to his latest run on medium tyres
12:52 - This is another ultra-consistent run from Vettel on the medium tyres. His last six laps have been within a couple of tenths.
13:12 - ... great stint on mediums at the end that featured 14 flying laps with supreme consistency

From here - link
Posted at
13:16 - Testing times update 4) Sebastian Vettel 1:21.127
11:17 - Testing times update 4) Sebastian Vettel 1:21.321
11:09 - Sebastian Vettel has the mileage and the pace as he rattles off a 1:21.321. That puts him third, two tenths behind Lewis Hamilton in P2 but Vettel's lap was done on mediums with Hamilton doing his best effort on softs.

From here - link
50 minutes until lunch - VET 1:21.136

From here - link
translated - ... Also, Sebastian Vettel at the end of the second hour improved and began to accelerate - 1: 21,558 and 1: 21,321 were performances that moved him ahead of Massa. Compared to the previous departure this time chose a medium tyres.
... Vettel remains at medium compounds, improvement of 7 thousandths is not much. At least it was the first managed to overcome the threshold of 66 laps
Art without engineering is dreaming. Engineering without art is calculating. Steven K. Roberts

User avatar
whatthefat
0
Joined: 13 Sep 2014, 01:02

Re: F1 2016 vs 2017: mathematical/statistical comparison

Post

Mr.G wrote:
whatthefat wrote:
ferkan wrote:Hey whatthefat! Fantastic work, much better then ...
Thank you! So I checked this one out and it wasn't in the f1debrief stints published, so not in my dataset, but it may indeed be comparable to the Mercedes soft stint. Unfortunately, it isn't 100% clear to me how to interpret that autosport commentary. It could be that he started with a couple of quick laps then settled into a consistent but slower pace for 6+ laps. How I wish we had all the data!
Hi whatthefat, I've scrutinized the internet, did some magic and found a few more info about the Vettel's stint. I know it's not much but could you plase do youre magic and try to compare this to the Hamiltons stint?

From here - link
12:42 - The Ferrari driver has clocked a 1m21.127s
12:43 - Vettel follows up his 1m21.1s with a 1m21.4s. Good start to his latest run on medium tyres
12:52 - This is another ultra-consistent run from Vettel on the medium tyres. His last six laps have been within a couple of tenths.
13:12 - ... great stint on mediums at the end that featured 14 flying laps with supreme consistency

From here - link
Posted at
13:16 - Testing times update 4) Sebastian Vettel 1:21.127
11:17 - Testing times update 4) Sebastian Vettel 1:21.321
11:09 - Sebastian Vettel has the mileage and the pace as he rattles off a 1:21.321. That puts him third, two tenths behind Lewis Hamilton in P2 but Vettel's lap was done on mediums with Hamilton doing his best effort on softs.

From here - link
50 minutes until lunch - VET 1:21.136

From here - link
translated - ... Also, Sebastian Vettel at the end of the second hour improved and began to accelerate - 1: 21,558 and 1: 21,321 were performances that moved him ahead of Massa. Compared to the previous departure this time chose a medium tyres.
... Vettel remains at medium compounds, improvement of 7 thousandths is not much. At least it was the first managed to overcome the threshold of 66 laps
It sounds like a really strong stint overall, but I'm having some trouble seeing how to piece it together to get more than a few of the actual lap times. Are you able to solve it?

zac510
zac510
22
Joined: 24 Jan 2006, 12:58

Re: F1 2016 vs 2017: mathematical/statistical comparison

Post

If someone made up a spreadsheet with a column for day/timestamp, columns for each live commentary source and then ran the laptimes in rows downwards, perhaps each data set could be matched up where they reported on the same laptimes. Then in the end, merge them to create as much of a dataset as possible.
There might be a few other commentary sources in different languages that our multi-lingual members can use!

User avatar
Mr.G
34
Joined: 10 Feb 2010, 22:52
Location: Slovakia

Re: F1 2016 vs 2017: mathematical/statistical comparison

Post

Yes, that was my intention. So far we know about 4-6 lap times. It would be great if someone from Italy checked they local pages as it's Italian team and maybe someone from Germany as it was Vettel's day. If someone want to search for more info it was on the First day of Second test. Or some times it's also named as the Fifth day of the test. And it was 07-MAR-2017 and it was the last stint before launch break (started about 12:40).

I relay would like to see the collective effort on this :)
Art without engineering is dreaming. Engineering without art is calculating. Steven K. Roberts

F1ern
F1ern
16
Joined: 15 Feb 2016, 08:19

Re: F1 2016 vs 2017: mathematical/statistical comparison

Post

Guys chill, it does not matter. 1 week and we will see them in action. There will be no more hiding. :)

User avatar
Mr.G
34
Joined: 10 Feb 2010, 22:52
Location: Slovakia

Re: F1 2016 vs 2017: mathematical/statistical comparison

Post

Well where is the fun in it (waiting)? :P
Art without engineering is dreaming. Engineering without art is calculating. Steven K. Roberts